


Machina

Nineteen industries

One growth engine.

Design, advertising, development, and marketing built for the sectors driving what comes next — AI, fintech, health tech, and beyond.

All industries

Machina — Marketing that moves numbers.

Start a free strategy call

Marketing thatfills yourshopping carts.

Retail & E-Commerce Marketing Agency

By the time a shopper sees the shipping line, you have already paid for the visit. Traffic is rarely the problem. 70% of carts end there, 85.65% on mobile, so we begin at checkout, where Baymard puts the average large-store redesign lift near 35%. Owned channels next: one apparel brand's dead list became $541K in email revenue in six months.

Talk to us

Let's talk about your market

No long-term contracts. Free audit to start.

By submitting this form you agree to our Privacy Policy.

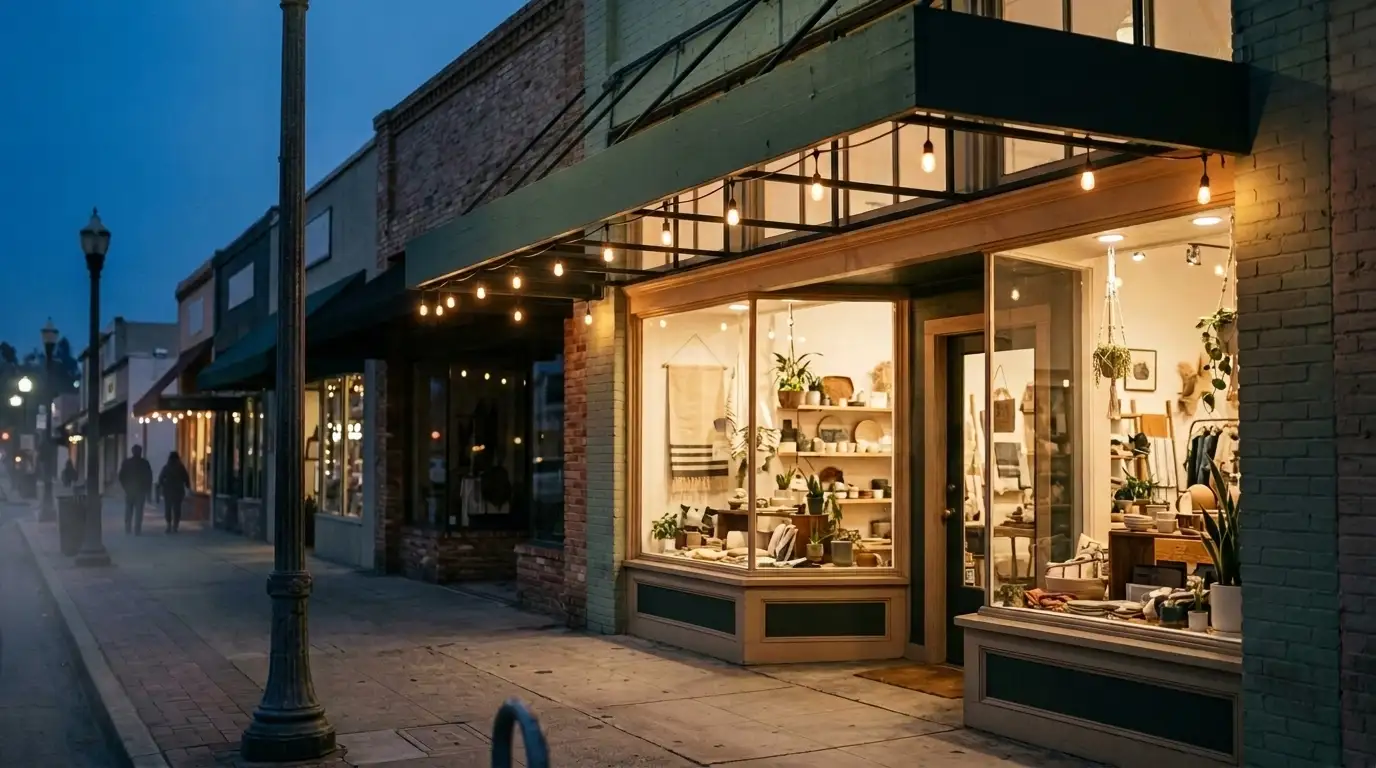
Small-town California main street boutique storefront at dusk, its display window glowing warm under an awning strung with lights at blue hour

What makes Retail & E-Commerce different

The math this business runs against

Acquisition keeps getting more expensive. A US DTC retail brand paid $226 on average to win a customer in 2024, Meta CPMs peaked near $23 in Q4, and Google Shopping CPCs climbed about 34% in 2025. Shopify takes 3–4.5% of revenue in plan, processing, and app fees before an ad runs. Amazon holds 35.7% of US e-commerce and keeps the customer data that comes with it. Then shoppers abandon 70% of the carts you paid to fill. A plan only counts if it makes money inside those numbers.

What we hear

What store owners bring up first

Four things retail and e-commerce operators say on an opening call, and the fix behind each one.

My ROAS looks great and my bank account disagrees

Since iOS 14, last-click dashboards overcount. Meta and Google both claim the customer your email list would have converted on its own, so two platforms bill you for one order. We measure MER and new-customer revenue against contribution margin per order, then rebuild the prospecting and retargeting split so spend buys growth instead of re-buying the list you already own.

Paid Ads

We get plenty of traffic and almost no orders

They order somewhere. Mobile carts abandon at 85.65%, and 48% of US abandoners point at surprise shipping and fees on the checkout screen (Baymard). Checkout and product pages get rebuilt before anything else, because the roughly 35% conversion lift Baymard attributes to checkout redesign is worth more than any traffic you could buy with the same money.

Web Development

Our email list has 8,000 names and produces nothing

Those 8,000 names are inventory sitting in a back room. Flows generate about 41% of email revenue from 5.3% of sends, so a list running without welcome, abandoned-cart, and winback automation produces roughly what yours does. We built one apparel brand's program from a dead list to $541K in email revenue in six months.

Email Marketing

Locals drive to San Jose or default to Amazon instead of walking in

A town the size of Hollister leaks an estimated $26M a year in retail spending to other cities, and 76% of near-me searchers visit a store within 24 hours. That second number is the recovery. We put your products into your Google Business Profile and your live inventory into local search, so the shopper five minutes away sees the item in stock before Amazon offers to ship it.

SEO

What we do

Five services, run on store math

Break-even ROAS, contribution margin per order, cart abandonment, the Q4 calendar. The work below is judged on those, not on platform dashboards.

Web Development

Checkout redesign alone lifts conversion about 35% at the average large store, and the average US checkout still asks for 23-plus form elements when 12 to 14 would do (Baymard). We build and rebuild Shopify and headless storefronts against that math. Mobile pages load under 2.5 seconds, which matters more each year as 56% of holiday orders come from phones. Checkouts get trimmed. Product pages know what is in stock, and stores with a front door get pickup wired in.

SEO

Retail SEO happens on collection pages, in product schema, and through internal linking. Blog posts rarely move a store. We structure category pages to take buy-intent and long-tail queries, then add Product and FAQ schema so listings earn rich results and citations in AI answers, a channel Adobe measured growing 693% in a year with visitors converting 31% better. Stores with a front door also get Google Business Profile products, review velocity, and city pages aimed at near-me demand.

Paid Ads

An e-commerce click averages $1.16 against $5.26 across all industries, and Google Shopping returned about 5:1 median ROAS in 2025, because the shopper is already typing the product name. The lever there is feed quality: titles, GTINs, price competitiveness. We fix the feed before touching bids, split Meta prospecting (2.2:1 benchmark) from retargeting (3.6:1) so one does not flatter the other, and report MER and new-customer revenue rather than platform ROAS.

Email Marketing

Klaviyo puts flows at about 41% of email revenue off 5.3% of sends, nearly 18x the revenue per recipient that campaigns produce. So the automation gets built first: welcome, abandoned cart, browse abandonment, post-purchase, winback, VIP, back-in-stock. A campaign calendar follows your seasonality, with SMS reserved for the high-intent moments. We aim for 25–35% of store revenue from owned channels. The apparel brand reached 24% and $541K inside six months.

AI Automation

In a store, automation means the work nobody has time for at 4,000 SKUs: feed hygiene across titles, descriptions, and GTINs, review requests that fire after delivery rather than after purchase, and support replies drafted from your own policies. Inventory drives its own marketing, with low-stock urgency and back-in-stock alerts that sell without a discount code. We also make the store legible to agentic shopping through structured data and machine-readable policies, so assistants can find and cite you as that traffic grows.

Who we work with

Who we work with

The store side of retail: storefronts, feeds, foot traffic, and flows. Brand strategy for packaged-goods makers lives on our consumer-goods page.

Shopify & DTC stores

Average DTC acquisition cost hit $226 in 2024, so the work is AOV, conversion rate, and flows before ad spend. A 50%-margin store breaks even at 2.0x ROAS; we do that math before touching budgets.

Main Street retailers

Hollister leaks an estimated $26M a year in retail spending, roughly $700 per resident, to out-of-town stores and Amazon. Google Business Profile products, review velocity, and in-store pickup recapture it.

Tourist-district shops

Monterey County logged a record $3.1B in visitor spending in 2024. Carmel galleries, Cannery Row, and downtown Santa Cruz shops win by capturing the tourist's email at the register and shipping home all year.

Marketplace sellers

Amazon holds 35.7% of US e-commerce and keeps the customer data. We run the halo play: win discovery there, pull repeat purchases onto your own site where the margin lives.

Hybrid store + online

Omnichannel customers spend about 1.5x more per month and show roughly 30% higher lifetime value. Inventory-aware product pages, local inventory ads, and in-store pickup make one business out of two channels.

AI visibility

AI Search Visibility for Retailers

AI-referred shoppers arrive already sold. Adobe measured a 693% one-year jump in retail traffic from AI tools over holiday 2025, and those visitors converted 31% better than other referrals. The assistant did the comparing first. It compares on product data, review signal, and buying answers in plain text. It never runs JavaScript, so specs and stock rendered client side are specs nobody reads. We add Product schema, shipping and return terms a machine can read, and FAQ content written to be quoted, so your store is the one named. One free SEO report settles the first question, which is whether a machine reads your catalog as text at all.

$541K

Email revenue in six months. One apparel brand's owned list.

70%

of online carts are abandoned before checkout

693%

one-year growth in AI-referred traffic to retail sites

Seven of every ten carts on your site get abandoned. Buying more traffic before you fix that is paying twice for the same shopper.

Case study

From a dead email list to $541K in six months

The client is an apparel e-commerce brand whose email program had gone quiet: campaigns landed in spam, automated flows didn't exist, and email carried 20% of revenue mostly on discounting. We repaired deliverability first, because nothing else matters while messages land in junk folders. Then we rebuilt every template with A/B testing on subject lines, layouts, and send times. Then came the VIP program: 3,000 members joined in the first three days, 14,000 within six months, from a standing start, and the launch campaign hit a 67% open rate against a 38% industry average. The program produced $541K in email revenue and moved email's share of store revenue from 20% to 24%, margin the brand never had to buy with ad spend. This is the channel we build first for any store already paying for traffic: it monetizes the visitors you already own.

Read the case study
$541K
Email revenue in six months

The Owned-Revenue System

How we work

The Owned-Revenue System: three phases, one metric. Contribution margin, not platform ROAS.

01

Tear down the funnel

A free teardown of your own store: checkout friction, missing flows, feed errors, attribution gaps, and near-me visibility if you have a front door. Most stores lose more revenue at checkout than their ads bring in, so we measure the leaks before we touch spend.

02

Fix conversion and flows

Checkout fixes and the seven core email flows ship before we scale a dollar of paid media. Flows monetize the traffic you already paid for, at roughly 18x the revenue per recipient of campaigns, and push owned revenue toward the healthy 25–35% range.

03

Scale paid on margin math

Google Shopping, Meta, and local inventory ads scale against your break-even ROAS and MER, never platform dashboards alone. You keep ownership of the ad accounts, the list, and the data, so nothing we build resets if we ever part ways.

Playbook

The Retail & E-Commerce Marketing Playbook

E-commerce reached 16.4% of total US retail sales in 2025, per the US Census Bureau, which means more than 83% of retail still happens through a front door. The stores that win work both sides of that line. Nine tactics we run for Central Coast retailers and e-commerce brands, each with the math attached.

01

Fix the checkout before you buy another click

Shoppers abandon 70.22% of online carts, and 85.65% on mobile, where 56.4% of holiday transactions now happen (Baymard Institute; Adobe). The two biggest causes are self-inflicted: 48% of US abandoners cite surprise shipping, taxes, and fees, and the average US checkout still shows 23+ form elements when 12 to 14 does the job. Baymard estimates the average large store can lift conversion about 35% through checkout redesign alone, a bigger return than any ad campaign the same money could fund. Show shipping costs on the product page, offer guest checkout, cut every field that doesn't change fulfillment, and test the whole flow on a phone over a weak connection. Every ad dollar you spend passes through this bottleneck. Widen it first.
02

Build the seven flows before the next campaign

Automated flows generate about 41% of e-commerce email revenue from 5.3% of sends, at nearly 18x the revenue per recipient of one-off campaigns (Klaviyo, 2025). The seven that matter: welcome, abandoned cart, browse abandonment, post-purchase, winback, VIP, and back-in-stock. Welcome flows alone average a 1.97% placed-order rate, and the top decile reaches 9.89%, a 5x spread that comes down to craft. Add SMS at the high-intent moments: messages sent within 5 minutes of an action see click rates near 36%. This is the first thing we build for any store spending on ads without flows, because it monetizes traffic already paid for. Our apparel client's rebuilt email program produced $541K in six months and carried 24% of store revenue.
03

Fix the product feed before the bid strategy

Google Shopping delivered roughly 5:1 median ROAS in 2025 because the shopper is already searching for the product, and e-commerce clicks average $1.16 against a $5.26 all-industry average (WordStream). The lever is the feed, not the bids: complete GTINs, titles that front-load what people search (brand, product type, attribute), accurate availability, and competitive pricing, since Google demotes products priced above market. A $1,500–$3,000 monthly Shopping budget on a clean feed routinely outperforms a sloppy $10K Performance Max setup. For Central Coast stores with a front door, we add local inventory ads so the same feed answers "in stock near me." Run PMax only after the feed is right; it amplifies whatever you give it, errors included.
04

Measure MER and new-customer revenue, not platform ROAS

Post-iOS14, last-click dashboards overcount: Meta and Google each claim credit for customers your email flows would have converted anyway, so reported ROAS holds steady while blended efficiency quietly erodes. We track MER (total revenue over total ad spend) and new-customer revenue against contribution margin per order. The arithmetic that governs everything: break-even ROAS equals 1 divided by contribution margin. A 50%-margin store breaks even at 2.0x, and the 2025 blended e-commerce average sits at 2.87x (Triple Whale / Upcounting). Stores that scale on platform ROAS buy revenue; stores that scale on MER buy profit. Ad budgets at Machina move only when the margin math clears, which is why our paid media reporting opens with MER, not screenshots of Ads Manager.
05

Put your inventory where near-me searches can see it

76% of consumers who run a "near me" search on mobile visit a business within 24 hours, and 28% of local searches end in a purchase (Think with Google). Most Central Coast retailers are invisible to that demand: no products on the Google Business Profile, no local inventory feed, no "in stock near me" presence. Hollister's own General Plan puts a number on what invisibility costs: an estimated $26M a year in retail leakage, roughly $700 per resident, spent outside the city for lack of visible local options, a pattern repeated across Salinas Valley towns. The fix is mechanical. Load products and photos into your Business Profile, run a steady review-request cadence, wire a local inventory feed, and offer pickup, because 67% of buy-online-pickup-in-store customers buy something extra when they walk in.
06

Capture the tourist at the register, then sell all year

Monterey County logged a record $3.1B in visitor spending in 2024, up 5.7%, and Santa Cruz County added $1.44B, up 3.2%. That money walks through Carmel-by-the-Sea galleries, Cannery Row, downtown Santa Cruz, and Paso Robles tasting-room retail all season, then flies home. The play is converting a one-time visitor into a year-round DTC customer: capture email or SMS at the register (a discount on today's purchase, free shipping on the next), tag the contact by store location, and drop them into a welcome flow that ships olive oil, wine, apparel, and gifts to wherever they live. A shop on Ocean Avenue with 8,000 visitor emails and a working flow stack is a national e-commerce brand that happens to pay Carmel rent.
07

Treat Amazon as a channel, not a landlord

Amazon holds 35.7% of US e-commerce, about $440B in sales, and Shopify-powered stores hold another 14%; together they are half the $1.2 trillion market (Marketplace Pulse, 2025). For most product categories the demand already lives on Amazon, but each sale there costs roughly 15% in referral fees plus FBA charges, and Amazon keeps the customer relationship. Run the halo strategy: win your branded search and category demand on Amazon, then move repeat purchases to your own site with package inserts, email capture, and subscribe-and-save pricing your Amazon listing can't match. Watch one ratio above all: the share of revenue Amazon controls. If losing the account tomorrow would kill the business, the next dollar of effort belongs to your DTC site, not another Amazon campaign.
08

Get your store ready for the AI shopper

Traffic to US retail sites from generative AI tools grew 693% year over year during holiday 2025, and those visitors converted 31% better than other online referrals while spending 45% more time on site (Adobe Analytics). ChatGPT and Perplexity recommend stores they can read: Product and Offer schema, clean structured data, machine-readable shipping and return policies, and FAQ content that answers buying questions in plain HTML. None of it requires new tooling; it is the same work that earns rich results in regular search, done to a standard machines can parse. We prepare client stores for agentic commerce now, while the traffic is small and compounding, because brands cited early become the default answers later. Our free SEO report includes an AI Visibility Score you can run today.
09

Plan Q4 in July, not October

30–40% of a typical store's annual revenue lands in Q4, and US consumers spent a record $257.8 billion online during the 2025 holiday season, up 6.8% (Adobe). The expensive mistake is funding November with cold traffic: Meta CPMs hit all-time highs near $23 in Q4, so brands that start prospecting in October pay peak prices for strangers. The cheap version runs all year. Build the list from spring, warm it with flows, and point Q4 budget at warm audiences and owned channels that cost nothing per send. By July you want the holiday calendar drafted, creative in production, and a Black Friday offer your margin can survive. The stores that treat Q4 as a harvest, and the rest of the year as planting, keep the season's profit.

Retail & E-Commerce

Let's have your flows running before Black Friday decides your year

Start with a free audit. We'll pull your checkout friction, missing flows, feed errors, and near-me visibility, and show you where revenue is leaking. Twenty minutes, no obligation.

Free audit first No long-term contracts Based in Hollister, California. Working nationwide.

Last updated July 4, 2026